|
|
Plus Minus Results |
|
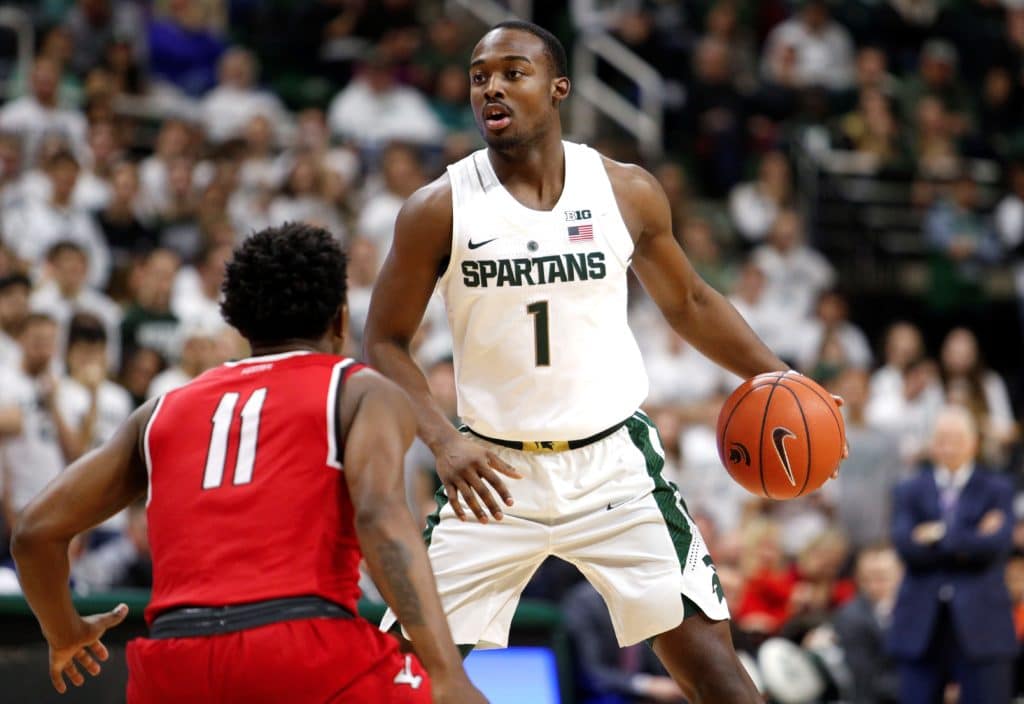
Carsen Edwards Purdue + 45 pts
Aaron Henry Michigan St + 26 pts
Josh Langford Michigan St <75 pts>
Bol Bol Oregon <63 pts>
|
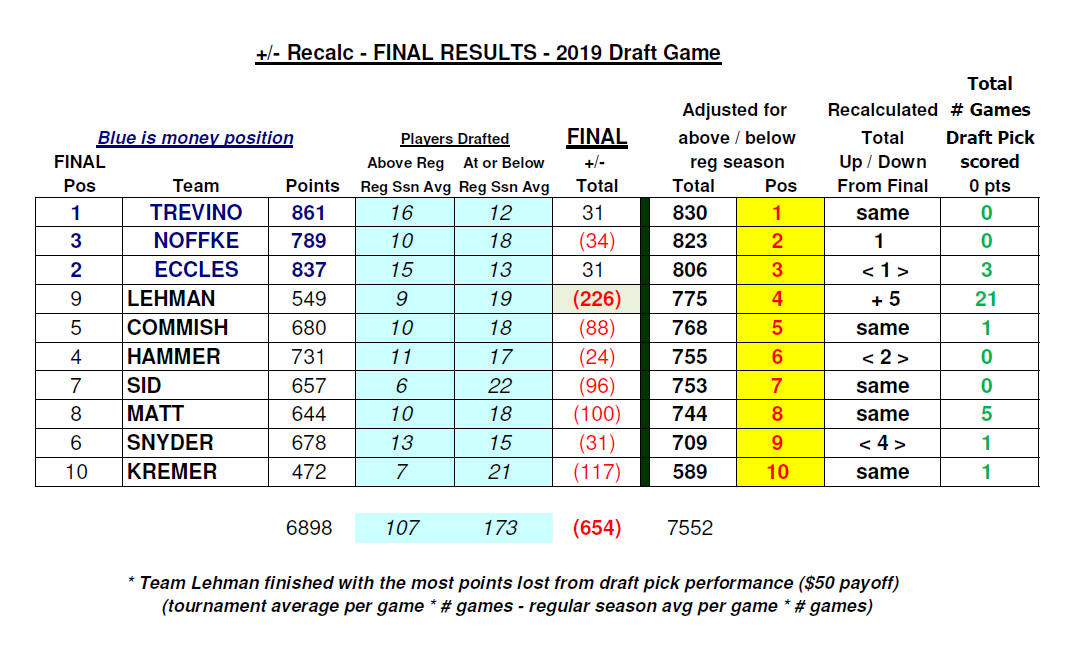
Plus <minus> payout: This payout portion was instituted a number of years ago to "reward" or payback if you will, the guy who got shafted the most out of his draft picks. There is a +/- column added to the printouts that calculates how many points your draft pick scored over or <under> his regular season average during the NCAA tournament. It's a simple calculation of multiplying the number of games played times the player's reg season average less the total points scored in the tournament. This becomes the +/- calculated number for each draft pick. Before the tournament starts, we can only go on what our draft picks scored per game during the regular season. We have no control over how they are asked to perform by the coaching staff or actually perform in pressure situations during the NCAA tournament, so their tournament scoring may or may not be affected negatively. We may also be affected by draft night mistakes where a player is drafted that for whatever reason probably or will not play in the tournament due to injury or suspension. This year the accumulated points lost from all 10 draft teams was an astounding <654>. We thought last year's <534> was really high only to do worse this year. For the 2nd year in a row, Team Lehman <226> led the way making last year's <184> way worse. Team Lehman had 21 games played by one of their draft picks where they scored 0 points. The next closest was Matt & Jeremiah with 5 such games. Team Lehman earned 1/2 of their entry fee back, again, for taking this honor in 2019. Team Kremer <117> and Matt & Jeremiah <100> had triple digit <-> amounts as well but combined they weren't as bad as the Lehman results. Had Team Noffke's draft picks scored at their regular seasonal average they would have finished (2nd) instead of 3rd where they ended up. On the opposite end, Team Trevino & Dave Eccles were the only two drafting teams to finish better than regular season with a +31 from their draft picks. The recalculated rerun of the points with the negative totals added back and the positive totals subtracted ended up at:
note: the player averages used are from ESPN.com's website after the regular season is over and before they play in any post season tournament game. The only exception to this would be from those teams who came out of nowhere to qualify which almost always happens and then we use whatever their end of the year (including post season tournament) average per game
Click on this link for the pdf plus minus results overall worst to best..................... Click on this link for the pdf plus minus results overall BY DRAFTER, best to worst.....................
|
This site was last updated 03/24/21